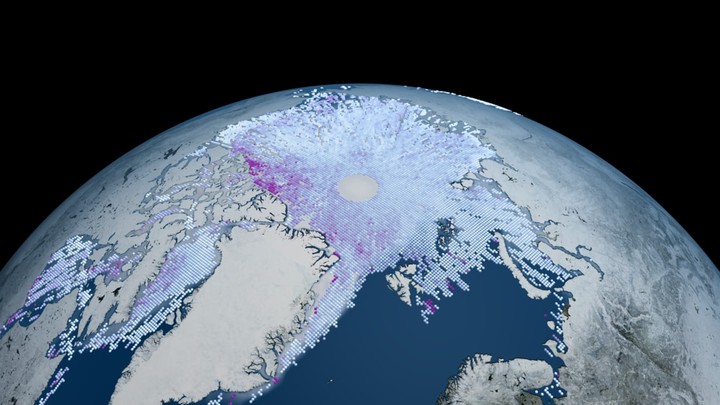
Studying Polar Ice sheets
 By NASA’s Scientific Visualization Studio.
The response of the cryosphere to increasing global temperatures has severe consequences for society. Predictions of the rate of sea-level rise through the next century rely on accurate understanding and modeling of glacier and ice sheet behavior. Remote sensing has provided a detailed and accurate record of the changing Greenland and Antarctic ice sheets, including observations of ice sheet elevation, velocity, and extent. Since the late 1990s these observations have revealed dramatic changes of many ice streams and outlet glaciers causing alarming mass loss. However, the significant spatiotemporal variability of ice velocity and elevation changes compounded by irregular observations in space and time makes the interpretation of the remote sensing record difficult. While regional trends exist, the different patterns of change within a single drainage basin and between neighboring glaciers indicate that the response of individual outlet glaciers to external forcings is highly modulated by local conditions.
A significant mathematical challenge is posed in dealing with irregularly distributed space-time data of highly variable quality that must be modeled for characterizing ice flow and surface properties and behavior. Data acquired by different sensors and missions often have different temporal and spatial coverage and sampling. Data quality can vary, and data gaps could occur due to system limitations, low atmospheric transmittance, or unfavorable surface conditions. Moreover, even data from the same mission should be interpolated to obtain snapshots of regional or ice sheet scale conditions, for example Digital Elevation Models (DEM) or annual thickness change rates, as the large size of the ice sheets (e.g., 14 million square Kms of Antarctica) prohibits a simultaneous or near-simultaneous observation of the entire ice sheet with high resolution and accuracy. For example, it takes 91 days for NASA’s new laser altimetry mission, ICESat-2, to complete a full cycle of observations. Accurate spatiotemporal modeling of ice sheet observations serves many purposes, including the monitoring of ice sheet elevation change and and mass loss or providing input for data assimilations into numerical ice sheet models.
Current approaches for analyzing time series of ice sheet changes (e.g., elevation, velocity) rely on simple models, such as low-order polynomials or a combination of linear interannual changes and seasonal signals estimated with a trigonometric function. As longer and more detailed time series become available, a need arises to accurately model complex and rapid spatiotemporal changes and derive robust error estimates, which are especially important in sparse sampled locations.
Our newly proposed approach, ALPS (Approximation by Localized Penalized Spline), is a penalized spline based framework for modeling cryospheric (ice sheets, glaciers, permafrost, sea ice) changes.
Here is a short video introducing ICESat-2 (Ice, Cloud, and land Elevation Satellite 2), part of NASA’s Earth Observing System for measuring ice sheet elevation and sea ice thickness, as well as land topography, vegetation characteristics, and clouds. Modeling the high resolution data from ICESat-2 currently serves as the major motivation for our research efforts.